Intern Student: Qi Qiao
Mentors: Dr. Naiara Pinto (JPL) / Prof. Yongkang Xue (UCLA)
We will study a tropical forest in La Salva, Costa Rica using field, lidar, and radar data and conduct biomass mapping in this area. Aboveground biomass is defined as the dry mass of live materials, excluding roots and include only trunk, branches and leaves. It is assumed that 50% of biomass is carbon, and 50% is nitrogen. There are two different tree level allometry, tree-level allometry and plot-level allometry. Tree level allometry is used to estimate biomass from diameter, height, and wood density. These allometric equations are generated by cutting trees down and baking them to figure out the relationship between the parameters above and biomass. Tree-level allometry is driven by tree shape and physical constraints that dictate the relationship between height and diameter. Wood density is highly influenced by climatic regimes and hydrology. Plot level allometry is the relationship between plot-level averages and plot-level biomass (Mg/ha). Plot-level allometry helps us pick remote sensing observations that can be correlated with biomass and is also what we are going to use in this research. Biomass plays an important role in studying global carbon cycle and measuring carbon emissions, which can help to achieve our goal of finding a “cost-effective climate change mitigation strategy”. In the tropics, biomass is of primary importance: knowing it allows calculation of the amount of carbon lost with deforestation. For most tropical forests, neither the averages nor the spatial distribution of biomass are known. Recent studies underestimated or the tropical emissions because they used the same data as forests in mid altitude area for biomass. For example, estimates of carbon emissions from the degradation of forests range from 5% for the world’s humid tropics to 25–42% for tropical Asia to 132% for tropical Africa. In this latter estimate, the loss of carbon from forest degradation was larger than from deforestation. The variation among estimates results, in large part, from the lack of spatially specific data on biomass and the difficulty of identifying and measuring changes in biomass.
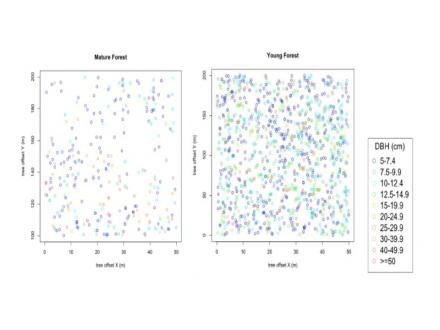
The goal is to look for other descriptors of forests that, in conjunction with ecological models and lidar, can be used to infer AGB. The tree descriptors would be provided and I will focus on the remote sensing data. These are: Tree size distribution, Tree density (trunks /ha), Basal area (m2 /ha), Volume (m3/ha), Mean trunk diameter (cm).